
U.S. Residential Sales Up 8 Percent From Year Ago, Median Prices Up 5 Percent
Bank-Owned Sales and Short Sales Account for 23 Percent of All Residential Sales
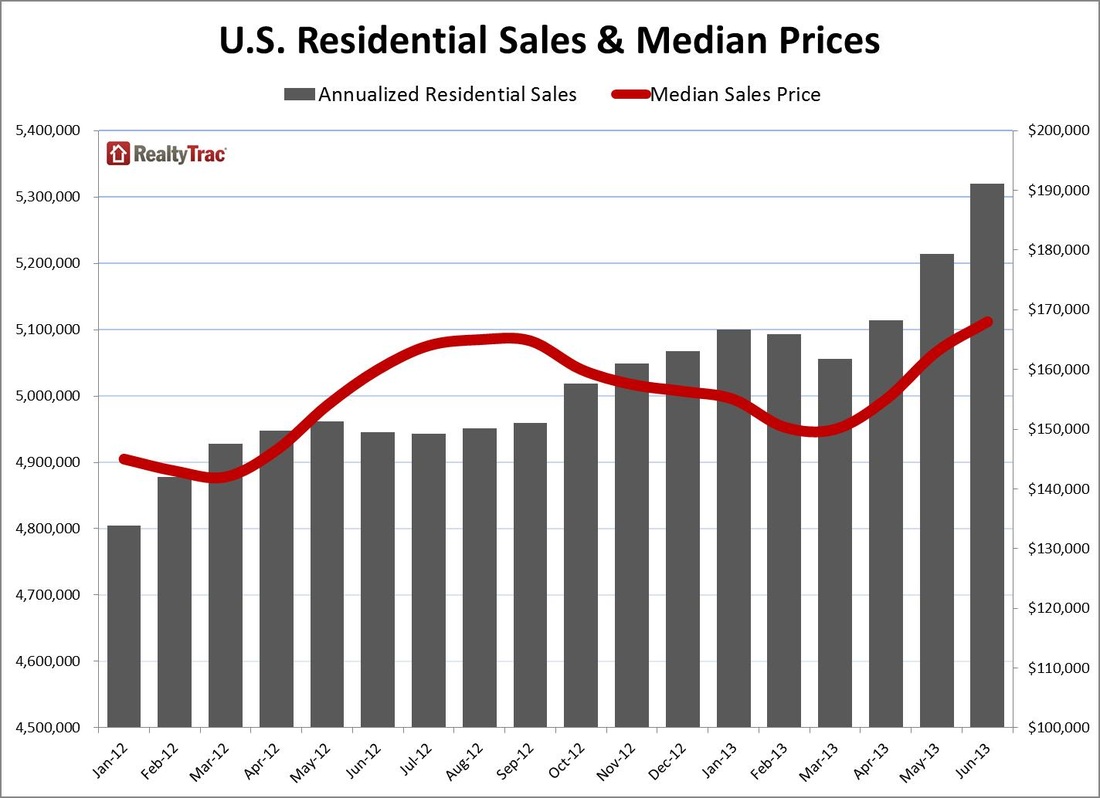
IRVINE, Calif. – July 25, 2013 — RealtyTrac® (www.realtytrac.com), the leading online marketplace for real estate data, today released its first-ever U.S. Residential Sales Report, which shows that U.S. residential property sales reached an estimated annualized pace of 5.3 million in June 2013, up 2 percent from the previous month and up 8 percent from a year ago.
The report also shows a national median sales price of $168,000 for the month, up 3 percent from the previous month and up 5 percent from a year ago. The median price of a distressed sale — in foreclosure or bank owned — was $120,000, 34 percent below the median price of a non-distressed sale ($181,500).
Other high-level findings from the report:
“Still, lingering distressed inventory in many markets will continue to provide fodder for institutional investors and cash buyers in those markets,” Blomquist continued. “Markets where sales increased in June tend to be in states with that lingering distressed inventory, whereas markets where sales decreased tend to be in states that more quickly absorbed distressed inventory thanks to a relatively fast foreclosure process and strong demand.”
Local broker perspectives
“I have an increasing number of home buyers in the Oklahoma City and Tulsa markets compared to a year ago but half of the inventory. This is causing a feeding frenzy that’s driving up the price of homes,” said Sheldon Detrick, CEO of Prudential Detrick/Alliance Realty in Oklahoma City and Tulsa. “Home values have increased so much that fewer people are upside-down on their homes. Last month’s increase in short sales is the tail end as short sales are becoming rarer. I guarantee there will not be any new short sales in the future.”
“There continues to be an increase in institutional investors in the Reno area based on the level of distress the market encountered during the economic downturn. Their purchases vary widely on a monthly basis depending on availability,” said Craig King, COO at Chase Internationalbrokerage serving the Reno and Lake Tahoe markets. “As the market continues to improve, the amount of REO and short sales have dramatically declined, and the market as a whole has made a return to equity sales.”
Report methodology
The RealtyTrac U.S. Residential Sales Report provides counts and median prices for sales of residential properties nationwide, by state and metropolitan statistical areas with a population of 500,000 or more. Data is also available at the county level upon request. The report also provides a breakdown of cash sales, institutional investor sales, short sales and bank-owned sales. The data is derived from recorded sales deeds and loan data, which is used to determine cash sales and short sales. Sales counts for recent months are projected based on seasonality and expected number of sales records for those months that are not yet available from public record sources but will be in the future given historical patterns.
Definitions
Residential property sales: sales of single family homes, condominiums/townhomes, and co-ops, not including multi-family properties.
Annualized sales: an annualized estimate of the number of residential property sales based on the actual number of sales deeds received for the month, accounting for expected sales records for that month that will be received in future months as well as seasonality.
Distressed sales: sale of a residential property that is actively in the foreclosure process or bank-owned when the sale is recorded.
Distressed discount: percentage difference between the median price of distressed sales and a non-distressed sales in a given geographic area.
Bank-Owned sales: sales of residential properties that have been foreclosed on and are owned by the foreclosing lender (bank).
Short sales: sales of residential properties where the sale price is below the combined total of outstanding mortgages secured by the property.
All-cash purchases: sales where no loan is recorded at the time of sale and where RealtyTrac has coverage of loan data.
Institutional investor purchases: residential property sales to non-lending entities that purchased at least 10 properties in the last 12 months.
Report License
The RealtyTrac U.S. Foreclosure Market Report is the result of a proprietary evaluation of information compiled by RealtyTrac; the report and any of the information in whole or in part can only be quoted, copied, published, re-published, distributed and/or re-distributed or used in any manner if the user specifically references RealtyTrac as the source for said report and/or any of the information set forth within the report.
Data Licensing and Custom Report Order
Investors, businesses and government institutions can contact RealtyTrac to license bulk foreclosure and neighborhood data or purchase customized reports. For more information contact our Data Licensing Department at 800.462.5193 or [email protected].
About RealtyTrac Inc.
RealtyTrac (www.realtytrac.com) is the leading supplier of U.S. real estate data, with more than 1.5 million active default, foreclosure auction and bank-owned properties, and more than 1 million active for-sale listings on its website, which also provides essential housing information for more than 100 million homes nationwide. This information includes property characteristics, tax assessor records, bankruptcy status and sales history, along with 20 categories of key housing-related facts provided by RealtyTrac’s wholly-owned subsidiary, Homefacts®. RealtyTrac’s foreclosure reports and other housing data are relied on by the Federal Reserve, U.S. Treasury Department, HUD, numerous state housing and banking departments, investment funds as well as millions of real estate professionals and consumers, to help evaluate housing trends and make informed decisions about real estate.
Bank-Owned Sales and Short Sales Account for 23 Percent of All Residential Sales
IRVINE, Calif. – July 25, 2013 — RealtyTrac® (www.realtytrac.com), the leading online marketplace for real estate data, today released its first-ever U.S. Residential Sales Report, which shows that U.S. residential property sales reached an estimated annualized pace of 5.3 million in June 2013, up 2 percent from the previous month and up 8 percent from a year ago.
The report also shows a national median sales price of $168,000 for the month, up 3 percent from the previous month and up 5 percent from a year ago. The median price of a distressed sale — in foreclosure or bank owned — was $120,000, 34 percent below the median price of a non-distressed sale ($181,500).
Other high-level findings from the report:
- All-cash purchases accounted for 30 percent of all sales in June, down from 31 percent of all sales in the previous month and a year ago. Metro areas with higher percentages of cash sales included Cape Coral-Fort Myers, Fla. (70 percent), Miami (64 percent), Las Vegas (62 percent), Sarasota, Fla. (59 percent), Tampa, Fla. (58 percent), and Detroit (56 percent).
- Institutional investor purchases (sales to non-lending entities that purchased at least 10 properties in the last 12 months) accounted for 9 percent of all residential sales in June, up from 8 percent of all sales in May but down from 10 percent of all sales in June 2012. States with the highest percentage of institutional investor sales included Georgia (23 percent), Nevada (16 percent), Arizona (15 percent), Oklahoma (13 percent), North Carolina (12 percent), and Florida (12 percent).
- Sales of bank-owned properties (REO) accounted for 9 percent of all residential sales in June, down from 10 percent in May 2013 and on par with a year ago. Metro areas where REO sales accounted for higher percentages of total sales included Detroit (24 percent), Modesto, Calif. (24 percent), Stockton, Calif. (24 percent), Las Vegas (22 percent), and Akron, Ohio (21 percent).
- Short sales (where the sale price is below the combined total of outstanding mortgages secured by the property) accounted for 14 percent of all residential sales in June, down from 15 percent in May but up from 8 percent a year ago. States with the highest percentage of short sales in June included Nevada (30 percent), Florida (29 percent), Maryland (21 percent), Tennessee (19 percent), and Arizona (19 percent).
- Metro areas with annual increases in median prices of 20 percent or more included Sacramento, Calif. (35 percent), San Francisco (30 percent), Los Angeles (27 percent), Las Vegas (26 percent), and Phoenix (25 percent).
- States with the biggest distressed sale discount included Ohio (58 percent), Michigan (48 percent), Illinois (47 percent), Massachusetts (46 percent), and Wisconsin (45 percent).
“Still, lingering distressed inventory in many markets will continue to provide fodder for institutional investors and cash buyers in those markets,” Blomquist continued. “Markets where sales increased in June tend to be in states with that lingering distressed inventory, whereas markets where sales decreased tend to be in states that more quickly absorbed distressed inventory thanks to a relatively fast foreclosure process and strong demand.”
Local broker perspectives
“I have an increasing number of home buyers in the Oklahoma City and Tulsa markets compared to a year ago but half of the inventory. This is causing a feeding frenzy that’s driving up the price of homes,” said Sheldon Detrick, CEO of Prudential Detrick/Alliance Realty in Oklahoma City and Tulsa. “Home values have increased so much that fewer people are upside-down on their homes. Last month’s increase in short sales is the tail end as short sales are becoming rarer. I guarantee there will not be any new short sales in the future.”
“There continues to be an increase in institutional investors in the Reno area based on the level of distress the market encountered during the economic downturn. Their purchases vary widely on a monthly basis depending on availability,” said Craig King, COO at Chase Internationalbrokerage serving the Reno and Lake Tahoe markets. “As the market continues to improve, the amount of REO and short sales have dramatically declined, and the market as a whole has made a return to equity sales.”
Report methodology
The RealtyTrac U.S. Residential Sales Report provides counts and median prices for sales of residential properties nationwide, by state and metropolitan statistical areas with a population of 500,000 or more. Data is also available at the county level upon request. The report also provides a breakdown of cash sales, institutional investor sales, short sales and bank-owned sales. The data is derived from recorded sales deeds and loan data, which is used to determine cash sales and short sales. Sales counts for recent months are projected based on seasonality and expected number of sales records for those months that are not yet available from public record sources but will be in the future given historical patterns.
Definitions
Residential property sales: sales of single family homes, condominiums/townhomes, and co-ops, not including multi-family properties.
Annualized sales: an annualized estimate of the number of residential property sales based on the actual number of sales deeds received for the month, accounting for expected sales records for that month that will be received in future months as well as seasonality.
Distressed sales: sale of a residential property that is actively in the foreclosure process or bank-owned when the sale is recorded.
Distressed discount: percentage difference between the median price of distressed sales and a non-distressed sales in a given geographic area.
Bank-Owned sales: sales of residential properties that have been foreclosed on and are owned by the foreclosing lender (bank).
Short sales: sales of residential properties where the sale price is below the combined total of outstanding mortgages secured by the property.
All-cash purchases: sales where no loan is recorded at the time of sale and where RealtyTrac has coverage of loan data.
Institutional investor purchases: residential property sales to non-lending entities that purchased at least 10 properties in the last 12 months.
Report License
The RealtyTrac U.S. Foreclosure Market Report is the result of a proprietary evaluation of information compiled by RealtyTrac; the report and any of the information in whole or in part can only be quoted, copied, published, re-published, distributed and/or re-distributed or used in any manner if the user specifically references RealtyTrac as the source for said report and/or any of the information set forth within the report.
Data Licensing and Custom Report Order
Investors, businesses and government institutions can contact RealtyTrac to license bulk foreclosure and neighborhood data or purchase customized reports. For more information contact our Data Licensing Department at 800.462.5193 or [email protected].
About RealtyTrac Inc.
RealtyTrac (www.realtytrac.com) is the leading supplier of U.S. real estate data, with more than 1.5 million active default, foreclosure auction and bank-owned properties, and more than 1 million active for-sale listings on its website, which also provides essential housing information for more than 100 million homes nationwide. This information includes property characteristics, tax assessor records, bankruptcy status and sales history, along with 20 categories of key housing-related facts provided by RealtyTrac’s wholly-owned subsidiary, Homefacts®. RealtyTrac’s foreclosure reports and other housing data are relied on by the Federal Reserve, U.S. Treasury Department, HUD, numerous state housing and banking departments, investment funds as well as millions of real estate professionals and consumers, to help evaluate housing trends and make informed decisions about real estate.


 RSS Feed
